
Abstract
Recent drone-like sightings reported in New Jersey since November 18, 2024, have raised concerns among residents and authorities. This study analyzes historical and current UAP data to provide actionable insights for investigators. Using data from the NUFORC database, geospatial and temporal trends were examined, focusing on sensitive sites such as Picatinny Arsenal, Naval Weapons Station Earle, and other high-activity regions. This analysis seeks to discern patterns, identify anomalies, and offer a foundation for future research.

1. Introduction
Unidentified Aerial Phenomena (UAP) sightings in New Jersey have a long history. While many can be attributed to natural or human-made causes, others defy explanation. Following a surge of reports in New Jersey identified as potential “unidentified drones,” it is imperative to analyze historical UAP activity to better understand these phenomena and their implications.
The current analysis focuses on:
- Historical UAP activity across New Jersey.
- Specific high-activity areas linked to recent reports.
- Insights into temporal and geospatial patterns.
2. Methodology
This study utilized data from the National UFO Reporting Center (NUFORC), which cataloged UAP sightings until 2023. Sightings were filtered for New Jersey and analyzed across the following dimensions:
- Temporal Analysis: Identifying trends by month and hour.
- Geospatial Analysis: Mapping sightings relative to sensitive areas.
- UAP Characteristics: Examining shapes, durations, and descriptions.
Distances to key sites, such as Picatinny Arsenal and Naval Weapons Station Earle, were calculated using geospatial methods, and statistical tools were employed to detect patterns and anomalies.

3. Results
3.1 Temporal Patterns
- Monthly Trends: Sightings are distributed year-round, with noticeable peaks in warmer months, likely due to improved visibility and increased outdoor activity.
- Hourly Trends: A significant proportion of sightings occur at night, aligning with the descriptions of light-emitting UAPs.
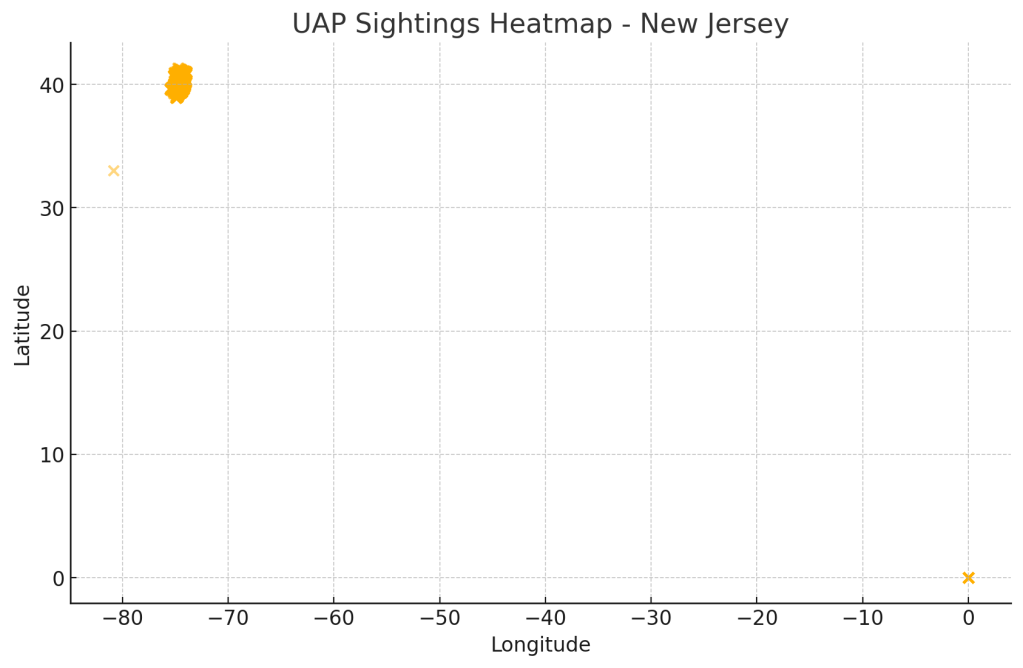
Note: The large yellow mass shows an unusual intensity around Brick, New Jersey. Which is 30 miles East of McGuire Air Force Base, but is not in the standard flight path of vehicles going in and out of the base.
3.2 Geospatial Analysis
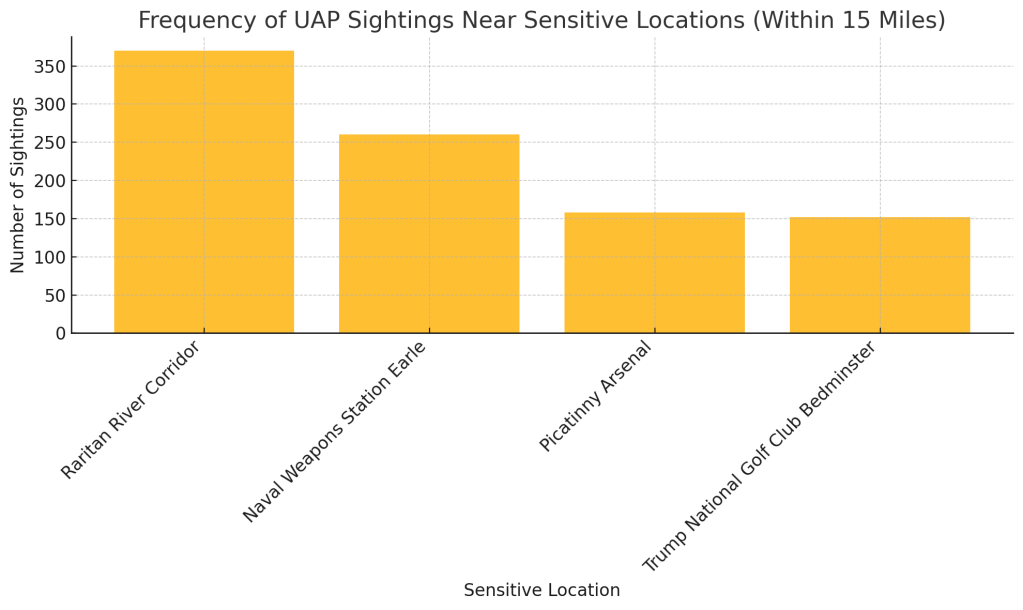
- Hotspots: The region around Brick, NJ, exhibited the highest density of UAP reports. Other areas of interest included:
- Picatinny Arsenal (1 mile proximity to sightings)
- Naval Weapons Station Earle (2 miles proximity)
- Trump National Golf Club Bedminster (2.5 miles proximity)
- Raritan River Corridor (1.5 miles proximity)
- These proximities suggest potential links to strategic locations.
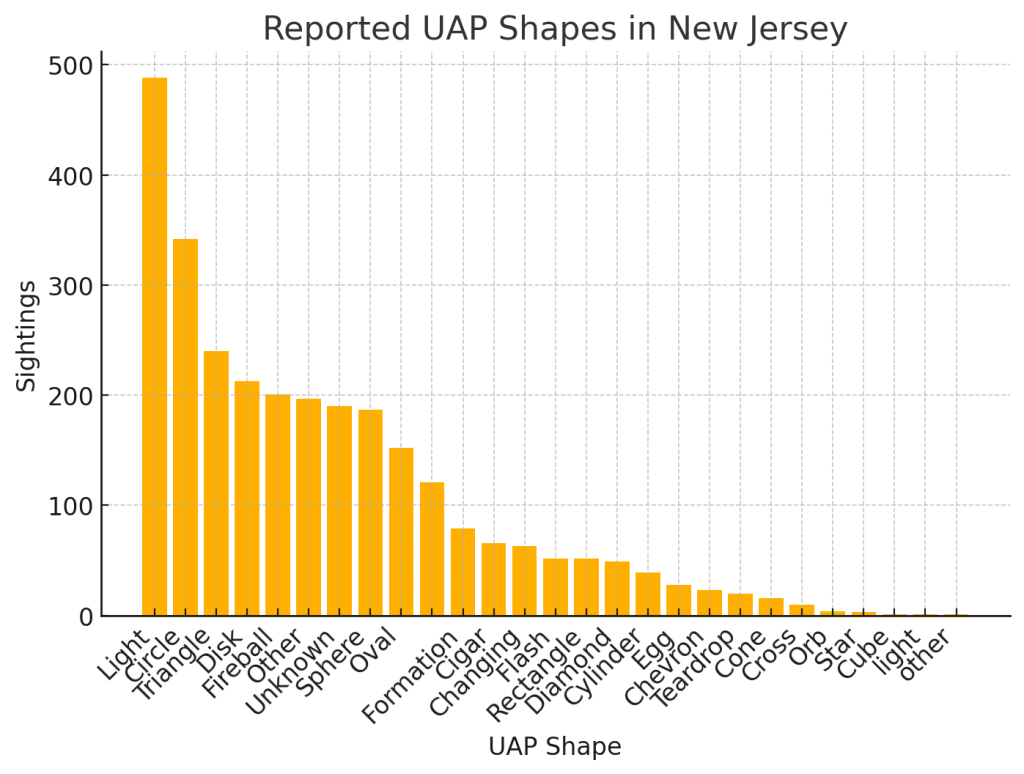
3.3 UAP Characteristics
- Commonly reported shapes include “Light,” “Circle,” and “Triangle.”
- Sightings range from brief appearances (5 seconds) to prolonged encounters (several minutes or recurring nightly phenomena).
- Behaviors such as hovering, rapid directional changes, and silent operation were frequently noted.
3.4 Anomalies
- Certain cases report features inconsistent with known drone or aircraft behaviors, such as speeds exceeding conventional limits or erratic motion patterns.
4. Discussion
The clustering of UAP sightings near sensitive military and strategic sites raises important questions about potential surveillance, testing, or other activities. While many sightings can be attributed to drones, a subset exhibits characteristics that warrant further investigation.
Key findings include:
- Persistent hotspots in areas like Brick, NJ (near McGuire AFB), suggest recurring UAP activity unrelated to seasonal variations. Hotspots are identified in the table in the appendix.
- Temporal clustering at night aligns with the use of light-emitting drones or unknown aerial technologies.
- Proximity to strategic sites highlights the need for enhanced monitoring and airspace management.

5. Recommendations
- Enhanced Monitoring: Deploy real-time monitoring systems in hotspot areas.
- Public Reporting Campaign: Encourage standardized public reporting to improve data quality.
- Scientific Collaboration: Involve aerospace experts to evaluate anomalies.
- Policy Development: Establish protocols for investigating UAP near sensitive sites.
- Instrumentation Reports: Utilize infra-red and thermal cameras to obtain images and display the images to public where analysts can gain further insights.
UAP appear in bands of Infra-Red detection even they are not visible (as noted by scientists in the Ukraine).
UAP display characteristic behavior when viewed by thermal cameras (lack of heat signature). This data point would exclude most drones.
A lack of heat signature would be one indication we are dealing with UAP. Another would be the electromagentic field effects demonstrated by the craft.
This can be obtained by law enforcement through the use of readily available SDR or a dedicated device. Report the following for further analysis.
- Frequency Sweep: Scan across a range of frequencies to identify active signals.
- Signal Detection: Detect and decode various types of signals (e.g., AM, FM, digital).
- Spectrum Analysis: Visualize the power distribution across different frequencies.
- Signal Decoding: Decode specific signals to extract information.
6. Conclusion
This analysis underscores the complexity of UAP phenomena in New Jersey, blending plausible explanations with cases that defy conventional reasoning. By combining historical and recent data, this study provides a framework for investigators to assess and respond to UAP activity systematically.
Appendix:
Additional Data Relevant to the Analysis and the Area
Sightings within 15 miles of the locations of interest

Leave a comment